
Weather
Weather Guide From lush forests and mountains to sunny beaches, know what to expect weather-wise
Welcome to your Costa Rica’s weather guide. Get a detailed 15-day weather and tide forecasts for major tourist destinations, weather FAQs, and insights into Costa Rica's diverse microclimates and seasons. Stay informed with real-time updates and expert tips to help you decide whether to visit during the wet or dry season. Dive in and make the most of your vacation time.
Current Weather Conditions
San Jose
Jul 29

Partly sunny
85°F
85°F
16.16 Mph,E
Liberia
Jul 29
Mostly sunny
92°F
95°F
16.16 Mph,ENE
Puntarenas
Jul 29
Partly sunny
85°F
85°F
16.16 Mph,E
Dry Season vs. Wet Season
Like waiting for the perfect moment to eat a ripe piece of fruit, every destination in Costa Rica has its own perfect season. Most often characterized as the dry season, it's the time of year when the rain disappears and the crisp rays of the sun fold through the foliage of the rainforest; prime weather for sun bathing, sunset watching, surfing, fishing, zip lining, hiking and just about every other thing you can think to do outside.
Weather FAQs
How is the weather in Costa Rica?
Costa Rica has a temperate tropical climate marked by two seasons: the dry (December- April) and the wet (May-November). The average temperature throughout the year is between 71°F and 81°F. During the rainy season, also known as the green season, mornings are generally sunny followed by late afternoon showers.
When is the rainy season in Costa Rica?
Costa Rica's rainy season lasts from May until November, and may extend into mid-December. Note that the Caribbean coast has its own weather patterns, and usually experiences its driest months in September and October.
Why is the rainy season often called the green season?
Due to the rains, the countryside becomes very lush during the wet season months. Literally every landscape transitions from brown to a vibrant green, lending the name "green season" to this low tourism period.
You May Want to Check the Weather inside the Region

Caribbean Region
The Caribbean weather region stretches from Tortuguero in the north all the way down to Gandoca Manzanillo at Costa Rica's southern tip. It also incl....
Continue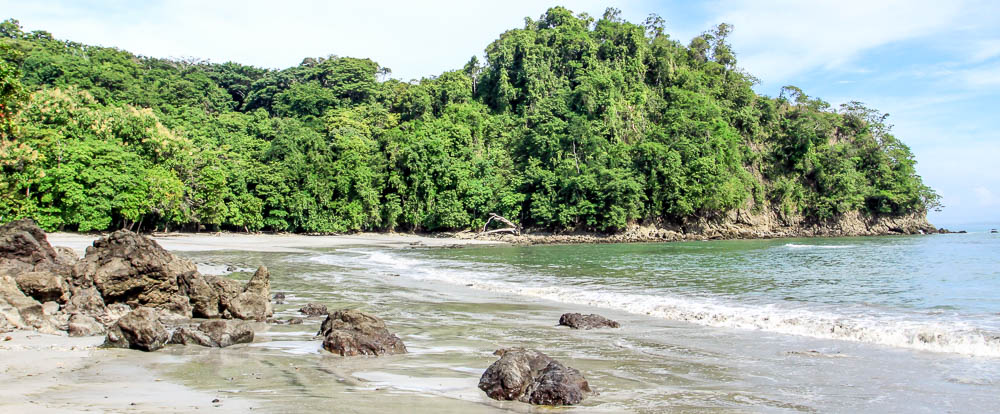
Central Pacific Region
The central Pacific weather region runs from the western parts of the San Jose and Puntarenas provinces, extending south from the Tarcoles River to th....
Continue
Central Valley Region
Costa Rica's Central Valley is the urban population center for good reason, with daily average temperatures between 72 and 75 degrees, the Central Val....
Continue
North Pacific Region
The north Pacific weather region includes some of Costa Rica's most popular tourist destinations and the country's driest weather in a province known ....
Continue
Northern Weather Region
The northern weather region spans from the north of Alajuela through the cloud forests of Monteverde, past Ciudad Quesada and Lake Arenal to the Nicar....
Continue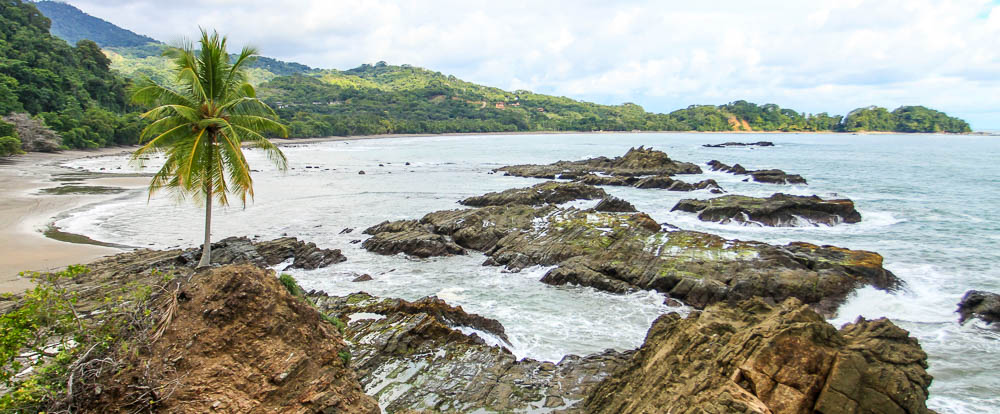
South Pacific Region
The south Pacific weather region, which includes the Osa Peninsula, the south Pacific coast from Dominical to Sierpe and the highest concentration of ....
ContinueAnnual Temperatures Per Town
Alajuela Yearly Temperatures
| Month | Highs | Lows | Average |
|---|---|---|---|
| Jan | 85.1 | 64.76 | 75.02 |
| Feb | 86.36 | 65.12 | 75.74 |
| Mar | 87.98 | 65.66 | 76.82 |
| Apr | 88.34 | 66.38 | 77.36 |
| May | 85.28 | 66.38 | 75.74 |
| Jun | 84.02 | 66.2 | 75.2 |
| Jul | 84.38 | 66.02 | 75.2 |
| Aug | 84.38 | 65.66 | 75.02 |
| Sep | 83.48 | 65.3 | 74.3 |
| Oct | 82.22 | 65.48 | 73.76 |
| Nov | 83.3 | 65.12 | 74.12 |
| Dec | 84.56 | 64.76 | 74.66 |
Arenal Yearly Temperatures
| Month | Highs | Lows | Average |
|---|---|---|---|
| Jan | 84.2 | 68.54 | 76.46 |
| Feb | 86 | 68 | 77 |
| Mar | 87.62 | 68.18 | 77.9 |
| Apr | 89.6 | 69.26 | 79.34 |
| May | 88.52 | 71.6 | 80.06 |
| Jun | 86.54 | 71.96 | 79.34 |
| Jul | 85.28 | 72.14 | 78.62 |
| Aug | 86.36 | 71.42 | 78.8 |
| Sep | 87.26 | 70.88 | 78.98 |
| Oct | 86.54 | 70.88 | 78.8 |
| Nov | 84.2 | 70.52 | 77.36 |
| Dec | 83.48 | 69.62 | 76.46 |
Arenal Volcano Yearly Temperatures
| Month | Highs | Lows | Average |
|---|---|---|---|
| Jan | 84.2 | 68.54 | 76.46 |
| Feb | 86 | 68 | 77 |
| Mar | 87.62 | 68.18 | 77.9 |
| Apr | 89.6 | 69.26 | 79.34 |
| May | 88.52 | 71.6 | 80.06 |
| Jun | 86.54 | 71.96 | 79.34 |
| Jul | 85.28 | 72.14 | 78.62 |
| Aug | 86.36 | 71.42 | 78.8 |
| Sep | 87.26 | 70.88 | 78.98 |
| Oct | 86.54 | 70.88 | 78.8 |
| Nov | 84.2 | 70.52 | 77.36 |
| Dec | 83.48 | 69.62 | 76.46 |
Brasilito Yearly Temperatures
| Month | Highs | Lows | Average |
|---|---|---|---|
| Jan | 91.4 | 74.3 | 82.94 |
| Feb | 93.2 | 75.56 | 84.38 |
| Mar | 94.46 | 76.64 | 85.46 |
| Apr | 94.46 | 77.18 | 85.82 |
| May | 90.5 | 75.38 | 82.94 |
| Jun | 88.52 | 74.66 | 81.68 |
| Jul | 89.42 | 74.3 | 81.86 |
| Aug | 88.7 | 73.94 | 81.32 |
| Sep | 87.44 | 73.76 | 80.6 |
| Oct | 85.82 | 73.58 | 79.7 |
| Nov | 87.8 | 73.04 | 80.42 |
| Dec | 89.78 | 73.04 | 81.32 |
Cabo Blanco Reserve Yearly Temperatures
| Month | Highs | Lows | Average |
|---|---|---|---|
| Jan | 93.02 | 67.1 | 80.06 |
| Feb | 94.82 | 67.1 | 80.96 |
| Mar | 96.26 | 70.16 | 83.12 |
| Apr | 95 | 72.5 | 83.66 |
| May | 91.22 | 73.94 | 82.58 |
| Jun | 89.96 | 73.94 | 81.86 |
| Jul | 90.14 | 73.22 | 81.68 |
| Aug | 89.96 | 73.4 | 81.68 |
| Sep | 89.24 | 72.5 | 80.78 |
| Oct | 87.62 | 72.14 | 79.88 |
| Nov | 89.06 | 71.06 | 80.06 |
| Dec | 90.86 | 68.9 | 79.88 |
Conchal Yearly Temperatures
| Month | Highs | Lows | Average |
|---|---|---|---|
| Jan | 91.4 | 74.3 | 82.94 |
| Feb | 93.2 | 75.56 | 84.38 |
| Mar | 94.46 | 76.64 | 85.46 |
| Apr | 94.46 | 77.18 | 85.82 |
| May | 90.5 | 75.38 | 82.94 |
| Jun | 88.52 | 74.66 | 81.68 |
| Jul | 89.42 | 74.3 | 81.86 |
| Aug | 88.7 | 73.94 | 81.32 |
| Sep | 87.44 | 73.76 | 80.6 |
| Oct | 85.82 | 73.58 | 79.7 |
| Nov | 87.8 | 73.04 | 80.42 |
| Dec | 89.78 | 73.04 | 81.32 |
El Jobo Yearly Temperatures
| Month | Highs | Lows | Average |
|---|---|---|---|
| Jan | 92.12 | 69.62 | 80.96 |
| Feb | 93.92 | 70.16 | 82.04 |
| Mar | 95.54 | 70.7 | 83.12 |
| Apr | 96.62 | 72.5 | 84.56 |
| May | 93.2 | 73.76 | 83.48 |
| Jun | 89.6 | 73.58 | 81.5 |
| Jul | 90.32 | 73.04 | 81.68 |
| Aug | 90.68 | 72.68 | 81.68 |
| Sep | 88.7 | 72.32 | 80.42 |
| Oct | 87.26 | 72.14 | 79.7 |
| Nov | 88.7 | 70.52 | 79.7 |
| Dec | 90.32 | 69.8 | 80.06 |
Flamingo Yearly Temperatures
| Month | Highs | Lows | Average |
|---|---|---|---|
| Jan | 91.4 | 74.3 | 82.94 |
| Feb | 93.2 | 75.56 | 84.38 |
| Mar | 94.46 | 76.64 | 85.46 |
| Apr | 94.46 | 77.18 | 85.82 |
| May | 90.5 | 75.38 | 82.94 |
| Jun | 88.52 | 74.66 | 81.68 |
| Jul | 89.42 | 74.3 | 81.86 |
| Aug | 88.7 | 73.94 | 81.32 |
| Sep | 87.44 | 73.76 | 80.6 |
| Oct | 85.82 | 73.58 | 79.7 |
| Nov | 87.8 | 73.04 | 80.42 |
| Dec | 89.78 | 73.04 | 81.32 |
Fortuna Yearly Temperatures
| Month | Highs | Lows | Average |
|---|---|---|---|
| Jan | 84.2 | 68.54 | 76.46 |
| Feb | 86 | 68 | 77 |
| Mar | 87.62 | 68.18 | 77.9 |
| Apr | 89.6 | 69.26 | 79.34 |
| May | 88.52 | 71.6 | 80.06 |
| Jun | 86.54 | 71.96 | 79.34 |
| Jul | 85.28 | 72.14 | 78.62 |
| Aug | 86.36 | 71.42 | 78.8 |
| Sep | 87.26 | 70.88 | 78.98 |
| Oct | 86.54 | 70.88 | 78.8 |
| Nov | 84.2 | 70.52 | 77.36 |
| Dec | 83.48 | 69.62 | 76.46 |
Golfito Yearly Temperatures
| Month | Highs | Lows | Average |
|---|---|---|---|
| Jan | 91.22 | 70.34 | 80.78 |
| Feb | 92.84 | 70.7 | 81.68 |
| Mar | 93.38 | 71.6 | 82.58 |
| Apr | 92.12 | 72.86 | 82.58 |
| May | 91.04 | 72.86 | 81.86 |
| Jun | 90.32 | 72.86 | 81.5 |
| Jul | 89.78 | 72.5 | 81.14 |
| Aug | 89.96 | 72.32 | 81.14 |
| Sep | 89.6 | 71.96 | 80.78 |
| Oct | 87.98 | 71.96 | 80.06 |
| Nov | 88.16 | 72.14 | 80.06 |
| Dec | 89.42 | 71.24 | 80.42 |
Golfo Dulce Yearly Temperatures
| Month | Highs | Lows | Average |
|---|---|---|---|
| Jan | 91.22 | 70.34 | 80.78 |
| Feb | 92.84 | 70.7 | 81.68 |
| Mar | 93.38 | 71.6 | 82.58 |
| Apr | 92.12 | 72.86 | 82.58 |
| May | 91.04 | 72.86 | 81.86 |
| Jun | 90.32 | 72.86 | 81.5 |
| Jul | 89.78 | 72.5 | 81.14 |
| Aug | 89.96 | 72.32 | 81.14 |
| Sep | 89.6 | 71.96 | 80.78 |
| Oct | 87.98 | 71.96 | 80.06 |
| Nov | 88.16 | 72.14 | 80.06 |
| Dec | 89.42 | 71.24 | 80.42 |
Heredia Yearly Temperatures
| Month | Highs | Lows | Average |
|---|---|---|---|
| Jan | 81.68 | 66.2 | 73.94 |
| Feb | 83.48 | 66.2 | 74.84 |
| Mar | 84.92 | 66.74 | 75.92 |
| Apr | 86.54 | 67.64 | 77.18 |
| May | 84.74 | 67.46 | 76.1 |
| Jun | 83.84 | 67.28 | 75.56 |
| Jul | 82.94 | 67.64 | 75.2 |
| Aug | 83.66 | 66.56 | 75.02 |
| Sep | 83.48 | 65.66 | 74.66 |
| Oct | 82.22 | 65.66 | 73.94 |
| Nov | 81.5 | 66.02 | 73.76 |
| Dec | 81.14 | 66.38 | 73.76 |
Langosta Yearly Temperatures
| Month | Highs | Lows | Average |
|---|---|---|---|
| Jan | 91.4 | 74.3 | 82.94 |
| Feb | 93.2 | 75.56 | 84.38 |
| Mar | 94.46 | 76.64 | 85.46 |
| Apr | 94.46 | 77.18 | 85.82 |
| May | 90.5 | 75.38 | 82.94 |
| Jun | 88.52 | 74.66 | 81.68 |
| Jul | 89.42 | 74.3 | 81.86 |
| Aug | 88.7 | 73.94 | 81.32 |
| Sep | 87.44 | 73.76 | 80.6 |
| Oct | 85.82 | 73.58 | 79.7 |
| Nov | 87.8 | 73.04 | 80.42 |
| Dec | 89.78 | 73.04 | 81.32 |
Liberia Yearly Temperatures
| Month | Highs | Lows | Average |
|---|---|---|---|
| Jan | 92.12 | 69.62 | 80.96 |
| Feb | 93.92 | 70.16 | 82.04 |
| Mar | 95.54 | 70.7 | 83.12 |
| Apr | 96.62 | 72.5 | 84.56 |
| May | 93.2 | 73.76 | 83.48 |
| Jun | 89.6 | 73.58 | 81.5 |
| Jul | 90.32 | 73.04 | 81.68 |
| Aug | 90.68 | 72.68 | 81.68 |
| Sep | 88.7 | 72.32 | 80.42 |
| Oct | 87.26 | 72.14 | 79.7 |
| Nov | 88.7 | 70.52 | 79.7 |
| Dec | 90.32 | 69.8 | 80.06 |
Mal Pais Yearly Temperatures
| Month | Highs | Lows | Average |
|---|---|---|---|
| Jan | 93.02 | 67.1 | 80.06 |
| Feb | 94.82 | 67.1 | 80.96 |
| Mar | 96.26 | 70.16 | 83.12 |
| Apr | 95 | 72.5 | 83.66 |
| May | 91.22 | 73.94 | 82.58 |
| Jun | 89.96 | 73.94 | 81.86 |
| Jul | 90.14 | 73.22 | 81.68 |
| Aug | 89.96 | 73.4 | 81.68 |
| Sep | 89.24 | 72.5 | 80.78 |
| Oct | 87.62 | 72.14 | 79.88 |
| Nov | 89.06 | 71.06 | 80.06 |
| Dec | 90.86 | 68.9 | 79.88 |
Manuel Antonio Yearly Temperatures
| Month | Highs | Lows | Average |
|---|---|---|---|
| Jan | 88.34 | 71.42 | 79.88 |
| Feb | 89.78 | 71.78 | 80.78 |
| Mar | 90.68 | 73.04 | 81.86 |
| Apr | 90.32 | 74.12 | 82.22 |
| May | 88.34 | 74.12 | 81.32 |
| Jun | 87.62 | 73.76 | 80.78 |
| Jul | 87.44 | 73.4 | 80.42 |
| Aug | 87.26 | 73.22 | 80.24 |
| Sep | 86.9 | 72.86 | 79.88 |
| Oct | 86.18 | 73.22 | 79.7 |
| Nov | 86 | 73.04 | 79.52 |
| Dec | 87.26 | 72.5 | 79.88 |
Manzanillo Yearly Temperatures
| Month | Highs | Lows | Average |
|---|---|---|---|
| Jan | 84.02 | 70.52 | 77.36 |
| Feb | 85.82 | 70.34 | 78.08 |
| Mar | 86.18 | 70.88 | 78.44 |
| Apr | 88.16 | 72.68 | 80.42 |
| May | 89.24 | 73.58 | 81.5 |
| Jun | 89.42 | 74.3 | 81.86 |
| Jul | 86.54 | 73.58 | 80.06 |
| Aug | 87.8 | 73.22 | 80.6 |
| Sep | 88.7 | 73.58 | 81.14 |
| Oct | 88.52 | 73.58 | 80.96 |
| Nov | 85.28 | 72.68 | 78.98 |
| Dec | 84.56 | 71.42 | 77.9 |
Montezuma Yearly Temperatures
| Month | Highs | Lows | Average |
|---|---|---|---|
| Jan | 93.02 | 67.1 | 80.06 |
| Feb | 94.82 | 67.1 | 80.96 |
| Mar | 96.26 | 70.16 | 83.12 |
| Apr | 95 | 72.5 | 83.66 |
| May | 91.22 | 73.94 | 82.58 |
| Jun | 89.96 | 73.94 | 81.86 |
| Jul | 90.14 | 73.22 | 81.68 |
| Aug | 89.96 | 73.4 | 81.68 |
| Sep | 89.24 | 72.5 | 80.78 |
| Oct | 87.62 | 72.14 | 79.88 |
| Nov | 89.06 | 71.06 | 80.06 |
| Dec | 90.86 | 68.9 | 79.88 |
Ocotal Yearly Temperatures
| Month | Highs | Lows | Average |
|---|---|---|---|
| Jan | 92.12 | 69.62 | 80.96 |
| Feb | 93.92 | 70.16 | 82.04 |
| Mar | 95.54 | 70.7 | 83.12 |
| Apr | 96.62 | 72.5 | 84.56 |
| May | 93.2 | 73.76 | 83.48 |
| Jun | 89.6 | 73.58 | 81.5 |
| Jul | 90.32 | 73.04 | 81.68 |
| Aug | 90.68 | 72.68 | 81.68 |
| Sep | 88.7 | 72.32 | 80.42 |
| Oct | 87.26 | 72.14 | 79.7 |
| Nov | 88.7 | 70.52 | 79.7 |
| Dec | 90.32 | 69.8 | 80.06 |
Osa Peninsula Yearly Temperatures
| Month | Highs | Lows | Average |
|---|---|---|---|
| Jan | 90.5 | 71.78 | 81.14 |
| Feb | 91.94 | 71.6 | 81.86 |
| Mar | 93.02 | 73.04 | 82.94 |
| Apr | 91.22 | 74.12 | 82.58 |
| May | 89.24 | 73.94 | 81.68 |
| Jun | 88.88 | 73.94 | 81.5 |
| Jul | 88.52 | 73.4 | 80.96 |
| Aug | 88.88 | 73.58 | 81.14 |
| Sep | 87.98 | 73.22 | 80.6 |
| Oct | 85.82 | 73.22 | 79.52 |
| Nov | 86.72 | 73.22 | 80.06 |
| Dec | 88.7 | 72.32 | 80.6 |
Papagayo Yearly Temperatures
| Month | Highs | Lows | Average |
|---|---|---|---|
| Jan | 92.12 | 69.62 | 80.96 |
| Feb | 93.92 | 70.16 | 82.04 |
| Mar | 95.54 | 70.7 | 83.12 |
| Apr | 96.62 | 72.5 | 84.56 |
| May | 93.2 | 73.76 | 83.48 |
| Jun | 89.6 | 73.58 | 81.5 |
| Jul | 90.32 | 73.04 | 81.68 |
| Aug | 90.68 | 72.68 | 81.68 |
| Sep | 88.7 | 72.32 | 80.42 |
| Oct | 87.26 | 72.14 | 79.7 |
| Nov | 88.7 | 70.52 | 79.7 |
| Dec | 90.32 | 69.8 | 80.06 |
Playa Avellanas Yearly Temperatures
| Month | Highs | Lows | Average |
|---|---|---|---|
| Jan | 91.4 | 74.3 | 82.94 |
| Feb | 93.2 | 75.56 | 84.38 |
| Mar | 94.46 | 76.64 | 85.46 |
| Apr | 94.46 | 77.18 | 85.82 |
| May | 90.5 | 75.38 | 82.94 |
| Jun | 88.52 | 74.66 | 81.68 |
| Jul | 89.42 | 74.3 | 81.86 |
| Aug | 88.7 | 73.94 | 81.32 |
| Sep | 87.44 | 73.76 | 80.6 |
| Oct | 85.82 | 73.58 | 79.7 |
| Nov | 87.8 | 73.04 | 80.42 |
| Dec | 89.78 | 73.04 | 81.32 |
Playa Cocles Yearly Temperatures
| Month | Highs | Lows | Average |
|---|---|---|---|
| Jan | 84.02 | 70.52 | 77.36 |
| Feb | 85.82 | 70.34 | 78.08 |
| Mar | 86.18 | 70.88 | 78.44 |
| Apr | 88.16 | 72.68 | 80.42 |
| May | 89.24 | 73.58 | 81.5 |
| Jun | 89.42 | 74.3 | 81.86 |
| Jul | 86.54 | 73.58 | 80.06 |
| Aug | 87.8 | 73.22 | 80.6 |
| Sep | 88.7 | 73.58 | 81.14 |
| Oct | 88.52 | 73.58 | 80.96 |
| Nov | 85.28 | 72.68 | 78.98 |
| Dec | 84.56 | 71.42 | 77.9 |
Playa Conchal Yearly Temperatures
| Month | Highs | Lows | Average |
|---|---|---|---|
| Jan | 91.4 | 74.3 | 82.94 |
| Feb | 93.2 | 75.56 | 84.38 |
| Mar | 94.46 | 76.64 | 85.46 |
| Apr | 94.46 | 77.18 | 85.82 |
| May | 90.5 | 75.38 | 82.94 |
| Jun | 88.52 | 74.66 | 81.68 |
| Jul | 89.42 | 74.3 | 81.86 |
| Aug | 88.7 | 73.94 | 81.32 |
| Sep | 87.44 | 73.76 | 80.6 |
| Oct | 85.82 | 73.58 | 79.7 |
| Nov | 87.8 | 73.04 | 80.42 |
| Dec | 89.78 | 73.04 | 81.32 |
Playa del Coco Yearly Temperatures
| Month | Highs | Lows | Average |
|---|---|---|---|
| Jan | 92.12 | 69.62 | 80.96 |
| Feb | 93.92 | 70.16 | 82.04 |
| Mar | 95.54 | 70.7 | 83.12 |
| Apr | 96.62 | 72.5 | 84.56 |
| May | 93.2 | 73.76 | 83.48 |
| Jun | 89.6 | 73.58 | 81.5 |
| Jul | 90.32 | 73.04 | 81.68 |
| Aug | 90.68 | 72.68 | 81.68 |
| Sep | 88.7 | 72.32 | 80.42 |
| Oct | 87.26 | 72.14 | 79.7 |
| Nov | 88.7 | 70.52 | 79.7 |
| Dec | 90.32 | 69.8 | 80.06 |
Playa Grande Yearly Temperatures
| Month | Highs | Lows | Average |
|---|---|---|---|
| Jan | 91.4 | 74.3 | 82.94 |
| Feb | 93.2 | 75.56 | 84.38 |
| Mar | 94.46 | 76.64 | 85.46 |
| Apr | 94.46 | 77.18 | 85.82 |
| May | 90.5 | 75.38 | 82.94 |
| Jun | 88.52 | 74.66 | 81.68 |
| Jul | 89.42 | 74.3 | 81.86 |
| Aug | 88.7 | 73.94 | 81.32 |
| Sep | 87.44 | 73.76 | 80.6 |
| Oct | 85.82 | 73.58 | 79.7 |
| Nov | 87.8 | 73.04 | 80.42 |
| Dec | 89.78 | 73.04 | 81.32 |
Playa Hermosa – Guanacaste Yearly Temperatures
| Month | Highs | Lows | Average |
|---|---|---|---|
| Jan | 92.12 | 69.62 | 80.96 |
| Feb | 93.92 | 70.16 | 82.04 |
| Mar | 95.54 | 70.7 | 83.12 |
| Apr | 96.62 | 72.5 | 84.56 |
| May | 93.2 | 73.76 | 83.48 |
| Jun | 89.6 | 73.58 | 81.5 |
| Jul | 90.32 | 73.04 | 81.68 |
| Aug | 90.68 | 72.68 | 81.68 |
| Sep | 88.7 | 72.32 | 80.42 |
| Oct | 87.26 | 72.14 | 79.7 |
| Nov | 88.7 | 70.52 | 79.7 |
| Dec | 90.32 | 69.8 | 80.06 |
Potrero Yearly Temperatures
| Month | Highs | Lows | Average |
|---|---|---|---|
| Jan | 91.4 | 74.3 | 82.94 |
| Feb | 93.2 | 75.56 | 84.38 |
| Mar | 94.46 | 76.64 | 85.46 |
| Apr | 94.46 | 77.18 | 85.82 |
| May | 90.5 | 75.38 | 82.94 |
| Jun | 88.52 | 74.66 | 81.68 |
| Jul | 89.42 | 74.3 | 81.86 |
| Aug | 88.7 | 73.94 | 81.32 |
| Sep | 87.44 | 73.76 | 80.6 |
| Oct | 85.82 | 73.58 | 79.7 |
| Nov | 87.8 | 73.04 | 80.42 |
| Dec | 89.78 | 73.04 | 81.32 |
Puerto Jimenez Yearly Temperatures
| Month | Highs | Lows | Average |
|---|---|---|---|
| Jan | 90.5 | 71.78 | 81.14 |
| Feb | 91.94 | 71.6 | 81.86 |
| Mar | 93.02 | 73.04 | 82.94 |
| Apr | 91.22 | 74.12 | 82.58 |
| May | 89.24 | 73.94 | 81.68 |
| Jun | 88.88 | 73.94 | 81.5 |
| Jul | 88.52 | 73.4 | 80.96 |
| Aug | 88.88 | 73.58 | 81.14 |
| Sep | 87.98 | 73.22 | 80.6 |
| Oct | 85.82 | 73.22 | 79.52 |
| Nov | 86.72 | 73.22 | 80.06 |
| Dec | 88.7 | 72.32 | 80.6 |
Puerto Viejo Yearly Temperatures
| Month | Highs | Lows | Average |
|---|---|---|---|
| Jan | 84.02 | 70.52 | 77.36 |
| Feb | 85.82 | 70.34 | 78.08 |
| Mar | 86.18 | 70.88 | 78.44 |
| Apr | 88.16 | 72.68 | 80.42 |
| May | 89.24 | 73.58 | 81.5 |
| Jun | 89.42 | 74.3 | 81.86 |
| Jul | 86.54 | 73.58 | 80.06 |
| Aug | 87.8 | 73.22 | 80.6 |
| Sep | 88.7 | 73.58 | 81.14 |
| Oct | 88.52 | 73.58 | 80.96 |
| Nov | 85.28 | 72.68 | 78.98 |
| Dec | 84.56 | 71.42 | 77.9 |
Puerto Viejo de Sarapiqui Yearly Temperatures
| Month | Highs | Lows | Average |
|---|---|---|---|
| Jan | 83.66 | 69.26 | 76.46 |
| Feb | 85.46 | 68.9 | 77.18 |
| Mar | 86.36 | 69.62 | 78.08 |
| Apr | 87.98 | 70.88 | 79.52 |
| May | 88.34 | 72.5 | 80.42 |
| Jun | 87.8 | 72.86 | 80.24 |
| Jul | 86 | 72.5 | 79.16 |
| Aug | 87.62 | 72.32 | 80.06 |
| Sep | 89.6 | 72.14 | 80.78 |
| Oct | 88.88 | 72.32 | 80.6 |
| Nov | 85.1 | 71.42 | 78.26 |
| Dec | 84.2 | 70.16 | 77.18 |
San Isidro del General Yearly Temperatures
| Month | Highs | Lows | Average |
|---|---|---|---|
| Jan | 82.22 | 63.68 | 73.04 |
| Feb | 84.38 | 64.04 | 74.12 |
| Mar | 85.46 | 64.76 | 75.2 |
| Apr | 83.84 | 65.48 | 74.66 |
| May | 81.68 | 65.3 | 73.58 |
| Jun | 79.7 | 65.84 | 72.68 |
| Jul | 79.7 | 65.3 | 72.5 |
| Aug | 80.42 | 64.76 | 72.68 |
| Sep | 80.6 | 64.58 | 72.68 |
| Oct | 79.34 | 64.22 | 71.78 |
| Nov | 78.98 | 64.4 | 71.78 |
| Dec | 80.42 | 64.04 | 72.32 |
San Jose Yearly Temperatures
| Month | Highs | Lows | Average |
|---|---|---|---|
| Jan | 73.4 | 61.34 | 67.46 |
| Feb | 74.48 | 61.52 | 68 |
| Mar | 76.28 | 62.24 | 69.26 |
| Apr | 78.08 | 63.5 | 70.88 |
| May | 79.16 | 64.58 | 71.78 |
| Jun | 78.98 | 64.58 | 71.78 |
| Jul | 77.54 | 64.4 | 70.88 |
| Aug | 78.44 | 64.22 | 71.24 |
| Sep | 79.34 | 63.68 | 71.42 |
| Oct | 77.9 | 63.5 | 70.7 |
| Nov | 75.56 | 63.14 | 69.26 |
| Dec | 73.94 | 62.24 | 68 |
San Pedro Yearly Temperatures
| Month | Highs | Lows | Average |
|---|---|---|---|
| Jan | 73.4 | 61.34 | 67.46 |
| Feb | 74.48 | 61.52 | 68 |
| Mar | 76.28 | 62.24 | 69.26 |
| Apr | 78.08 | 63.5 | 70.88 |
| May | 79.16 | 64.58 | 71.78 |
| Jun | 78.98 | 64.58 | 71.78 |
| Jul | 77.54 | 64.4 | 70.88 |
| Aug | 78.44 | 64.22 | 71.24 |
| Sep | 79.34 | 63.68 | 71.42 |
| Oct | 77.9 | 63.5 | 70.7 |
| Nov | 75.56 | 63.14 | 69.26 |
| Dec | 73.94 | 62.24 | 68 |
Santa Teresa Yearly Temperatures
| Month | Highs | Lows | Average |
|---|---|---|---|
| Jan | 93.02 | 67.1 | 80.06 |
| Feb | 94.82 | 67.1 | 80.96 |
| Mar | 96.26 | 70.16 | 83.12 |
| Apr | 95 | 72.5 | 83.66 |
| May | 91.22 | 73.94 | 82.58 |
| Jun | 89.96 | 73.94 | 81.86 |
| Jul | 90.14 | 73.22 | 81.68 |
| Aug | 89.96 | 73.4 | 81.68 |
| Sep | 89.24 | 72.5 | 80.78 |
| Oct | 87.62 | 72.14 | 79.88 |
| Nov | 89.06 | 71.06 | 80.06 |
| Dec | 90.86 | 68.9 | 79.88 |
Tamarindo Yearly Temperatures
| Month | Highs | Lows | Average |
|---|---|---|---|
| Jan | 91.4 | 74.3 | 82.94 |
| Feb | 93.2 | 75.56 | 84.38 |
| Mar | 94.46 | 76.64 | 85.46 |
| Apr | 94.46 | 77.18 | 85.82 |
| May | 90.5 | 75.38 | 82.94 |
| Jun | 88.52 | 74.66 | 81.68 |
| Jul | 89.42 | 74.3 | 81.86 |
| Aug | 88.7 | 73.94 | 81.32 |
| Sep | 87.44 | 73.76 | 80.6 |
| Oct | 85.82 | 73.58 | 79.7 |
| Nov | 87.8 | 73.04 | 80.42 |
| Dec | 89.78 | 73.04 | 81.32 |
Tortuguero Yearly Temperatures
| Month | Highs | Lows | Average |
|---|---|---|---|
| Jan | 84.56 | 69.26 | 77 |
| Feb | 85.82 | 68.9 | 77.36 |
| Mar | 86.72 | 69.62 | 78.26 |
| Apr | 87.8 | 71.06 | 79.52 |
| May | 88.34 | 72.86 | 80.6 |
| Jun | 88.88 | 73.22 | 81.14 |
| Jul | 87.08 | 72.86 | 80.06 |
| Aug | 87.98 | 72.5 | 80.24 |
| Sep | 89.78 | 72.32 | 81.14 |
| Oct | 89.42 | 72.32 | 80.78 |
| Nov | 86 | 71.24 | 78.62 |
| Dec | 84.92 | 70.34 | 77.72 |
Annual Rainfall Per Town
Alajuela Rainfall
| Month | Rainfall | Humidity | Rainy |
|---|---|---|---|
| % | Days | ||
| Jan | 0.25 | 65 | 3 |
| Feb | 0.43 | 62 | 3 |
| Mar | 0.68 | 63 | 3 |
| Apr | 2.83 | 69 | 9 |
| May | 10.31 | 83 | 23 |
| Jun | 9.5 | 86 | 23 |
| Jul | 6.07 | 83 | 20 |
| Aug | 8.07 | 85 | 21 |
| Sep | 12.32 | 88 | 26 |
| Oct | 12.65 | 89 | 27 |
| Nov | 6.5 | 83 | 18 |
| Dec | 1.5 | 73 | 9 |
Arenal Rainfall
| Month | Rainfall | Humidity | Rainy |
|---|---|---|---|
| % | Days | ||
| Jan | 7.87 | 83 | 16 |
| Feb | 4.63 | 79 | 11 |
| Mar | 3.37 | 77 | 10 |
| Apr | 2.57 | 77 | 9 |
| May | 10.82 | 84 | 21 |
| Jun | 15.15 | 87 | 25 |
| Jul | 16.87 | 88 | 27 |
| Aug | 15.36 | 87 | 26 |
| Sep | 14.87 | 86 | 26 |
| Oct | 15.46 | 86 | 25 |
| Nov | 14.56 | 88 | 24 |
| Dec | 11.18 | 87 | 21 |
Arenal Volcano Rainfall
| Month | Rainfall | Humidity | Rainy |
|---|---|---|---|
| % | Days | ||
| Jan | 7.87 | 83 | 16 |
| Feb | 4.63 | 79 | 11 |
| Mar | 3.37 | 77 | 10 |
| Apr | 2.57 | 77 | 9 |
| May | 10.82 | 84 | 21 |
| Jun | 15.15 | 87 | 25 |
| Jul | 16.87 | 88 | 27 |
| Aug | 15.36 | 87 | 26 |
| Sep | 14.87 | 86 | 26 |
| Oct | 15.46 | 86 | 25 |
| Nov | 14.56 | 88 | 24 |
| Dec | 11.18 | 87 | 21 |
Brasilito Rainfall
| Month | Rainfall | Humidity | Rainy |
|---|---|---|---|
| % | Days | ||
| Jan | 0.06 | 62 | 1 |
| Feb | 0.07 | 59 | 1 |
| Mar | 0.22 | 58 | 2 |
| Apr | 1.01 | 64 | 3 |
| May | 6.94 | 78 | 14 |
| Jun | 6.08 | 83 | 17 |
| Jul | 5.45 | 80 | 15 |
| Aug | 9.1 | 83 | 18 |
| Sep | 11.88 | 87 | 21 |
| Oct | 18.39 | 88 | 23 |
| Nov | 3 | 80 | 10 |
| Dec | 0.7 | 71 | 2 |
Cabo Blanco Reserve Rainfall
| Month | Rainfall | Humidity | Rainy |
|---|---|---|---|
| % | Days | ||
| Jan | 0.41 | 74 | 4 |
| Feb | 0.15 | 71 | 1 |
| Mar | 0.3 | 67 | 2 |
| Apr | 1.55 | 73 | 6 |
| May | 12.57 | 82 | 20 |
| Jun | 9.79 | 85 | 21 |
| Jul | 6.87 | 85 | 20 |
| Aug | 8.25 | 85 | 19 |
| Sep | 11.45 | 85 | 22 |
| Oct | 19.23 | 86 | 25 |
| Nov | 4 | 84 | 14 |
| Dec | 0.77 | 80 | 7 |
Conchal Rainfall
| Month | Rainfall | Humidity | Rainy |
|---|---|---|---|
| % | Days | ||
| Jan | 0.06 | 62 | 1 |
| Feb | 0.07 | 59 | 1 |
| Mar | 0.22 | 58 | 2 |
| Apr | 1.01 | 64 | 3 |
| May | 6.94 | 78 | 14 |
| Jun | 6.08 | 83 | 17 |
| Jul | 5.45 | 80 | 15 |
| Aug | 9.1 | 83 | 18 |
| Sep | 11.88 | 87 | 21 |
| Oct | 18.39 | 88 | 23 |
| Nov | 3 | 80 | 10 |
| Dec | 0.7 | 71 | 2 |
El Jobo Rainfall
| Month | Rainfall | Humidity | Rainy |
|---|---|---|---|
| % | Days | ||
| Jan | 0.09 | 60 | 1 |
| Feb | 0.13 | 56 | 2 |
| Mar | 0.14 | 54 | 1 |
| Apr | 1.57 | 57 | 3 |
| May | 8.28 | 73 | 15 |
| Jun | 7.25 | 81 | 16 |
| Jul | 4.52 | 77 | 13 |
| Aug | 7.62 | 80 | 18 |
| Sep | 13.4 | 86 | 23 |
| Oct | 14.27 | 87 | 22 |
| Nov | 3.81 | 79 | 11 |
| Dec | 0.41 | 68 | 3 |
Flamingo Rainfall
| Month | Rainfall | Humidity | Rainy |
|---|---|---|---|
| % | Days | ||
| Jan | 0.06 | 62 | 1 |
| Feb | 0.07 | 59 | 1 |
| Mar | 0.22 | 58 | 2 |
| Apr | 1.01 | 64 | 3 |
| May | 6.94 | 78 | 14 |
| Jun | 6.08 | 83 | 17 |
| Jul | 5.45 | 80 | 15 |
| Aug | 9.1 | 83 | 18 |
| Sep | 11.88 | 87 | 21 |
| Oct | 18.39 | 88 | 23 |
| Nov | 3 | 80 | 10 |
| Dec | 0.7 | 71 | 2 |
Fortuna Rainfall
| Month | Rainfall | Humidity | Rainy |
|---|---|---|---|
| % | Days | ||
| Jan | 7.87 | 83 | 16 |
| Feb | 4.63 | 79 | 11 |
| Mar | 3.37 | 77 | 10 |
| Apr | 2.57 | 77 | 9 |
| May | 10.82 | 84 | 21 |
| Jun | 15.15 | 87 | 25 |
| Jul | 16.87 | 88 | 27 |
| Aug | 15.36 | 87 | 26 |
| Sep | 14.87 | 86 | 26 |
| Oct | 15.46 | 86 | 25 |
| Nov | 14.56 | 88 | 24 |
| Dec | 11.18 | 87 | 21 |
Golfito Rainfall
| Month | Rainfall | Humidity | Rainy |
|---|---|---|---|
| % | Days | ||
| Jan | 3.78 | 83 | 14 |
| Feb | 3.1 | 80 | 12 |
| Mar | 5.41 | 80 | 15 |
| Apr | 10.65 | 84 | 21 |
| May | 20.34 | 88 | 28 |
| Jun | 21.3 | 88 | 26 |
| Jul | 20.2 | 88 | 26 |
| Aug | 19.9 | 88 | 28 |
| Sep | 22.12 | 89 | 27 |
| Oct | 27.45 | 90 | 30 |
| Nov | 21.78 | 90 | 28 |
| Dec | 8.5 | 87 | 21 |
Golfo Dulce Rainfall
| Month | Rainfall | Humidity | Rainy |
|---|---|---|---|
| % | Days | ||
| Jan | 3.78 | 83 | 14 |
| Feb | 3.1 | 80 | 12 |
| Mar | 5.41 | 80 | 15 |
| Apr | 10.65 | 84 | 21 |
| May | 20.34 | 88 | 28 |
| Jun | 21.3 | 88 | 26 |
| Jul | 20.2 | 88 | 26 |
| Aug | 19.9 | 88 | 28 |
| Sep | 22.12 | 89 | 27 |
| Oct | 27.45 | 90 | 30 |
| Nov | 21.78 | 90 | 28 |
| Dec | 8.5 | 87 | 21 |
Heredia Rainfall
| Month | Rainfall | Humidity | Rainy |
|---|---|---|---|
| % | Days | ||
| Jan | 0.26 | 62 | 2 |
| Feb | 0.52 | 60 | 2 |
| Mar | 0.61 | 60 | 2 |
| Apr | 3.85 | 65 | 9 |
| May | 9.05 | 76 | 19 |
| Jun | 8.36 | 78 | 20 |
| Jul | 6.09 | 74 | 17 |
| Aug | 7.93 | 76 | 19 |
| Sep | 12.26 | 81 | 23 |
| Oct | 12.58 | 82 | 23 |
| Nov | 4.74 | 75 | 15 |
| Dec | 0.95 | 67 | 5 |
Langosta Rainfall
| Month | Rainfall | Humidity | Rainy |
|---|---|---|---|
| % | Days | ||
| Jan | 0.06 | 62 | 1 |
| Feb | 0.07 | 59 | 1 |
| Mar | 0.22 | 58 | 2 |
| Apr | 1.01 | 64 | 3 |
| May | 6.94 | 78 | 14 |
| Jun | 6.08 | 83 | 17 |
| Jul | 5.45 | 80 | 15 |
| Aug | 9.1 | 83 | 18 |
| Sep | 11.88 | 87 | 21 |
| Oct | 18.39 | 88 | 23 |
| Nov | 3 | 80 | 10 |
| Dec | 0.7 | 71 | 2 |
Liberia Rainfall
| Month | Rainfall | Humidity | Rainy |
|---|---|---|---|
| % | Days | ||
| Jan | 0.09 | 60 | 1 |
| Feb | 0.13 | 56 | 2 |
| Mar | 0.14 | 54 | 1 |
| Apr | 1.57 | 57 | 3 |
| May | 8.28 | 73 | 15 |
| Jun | 7.25 | 81 | 16 |
| Jul | 4.52 | 77 | 13 |
| Aug | 7.62 | 80 | 18 |
| Sep | 13.4 | 86 | 23 |
| Oct | 14.27 | 87 | 22 |
| Nov | 3.81 | 79 | 11 |
| Dec | 0.41 | 68 | 3 |
Mal Pais Rainfall
| Month | Rainfall | Humidity | Rainy |
|---|---|---|---|
| % | Days | ||
| Jan | 0.41 | 74 | 4 |
| Feb | 0.15 | 71 | 1 |
| Mar | 0.3 | 67 | 2 |
| Apr | 1.55 | 73 | 6 |
| May | 12.57 | 82 | 20 |
| Jun | 9.79 | 85 | 21 |
| Jul | 6.87 | 85 | 20 |
| Aug | 8.25 | 85 | 19 |
| Sep | 11.45 | 85 | 22 |
| Oct | 19.23 | 86 | 25 |
| Nov | 4 | 84 | 14 |
| Dec | 0.77 | 80 | 7 |
Manuel Antonio Rainfall
| Month | Rainfall | Humidity | Rainy |
|---|---|---|---|
| % | Days | ||
| Jan | 2.31 | 82 | 7 |
| Feb | 1.09 | 78 | 4 |
| Mar | 1.54 | 78 | 5 |
| Apr | 6.2 | 82 | 13 |
| May | 16.62 | 86 | 22 |
| Jun | 16.16 | 87 | 23 |
| Jul | 17.33 | 87 | 25 |
| Aug | 19.55 | 88 | 26 |
| Sep | 20.83 | 88 | 25 |
| Oct | 24.54 | 89 | 26 |
| Nov | 15.19 | 89 | 23 |
| Dec | 6.17 | 85 | 15 |
Manzanillo Rainfall
| Month | Rainfall | Humidity | Rainy |
|---|---|---|---|
| % | Days | ||
| Jan | 8.25 | 88 | 18 |
| Feb | 8.77 | 85 | 18 |
| Mar | 8.58 | 84 | 18 |
| Apr | 6.81 | 85 | 15 |
| May | 11.44 | 86 | 20 |
| Jun | 8.81 | 87 | 19 |
| Jul | 16.14 | 88 | 25 |
| Aug | 7.94 | 86 | 18 |
| Sep | 5.06 | 85 | 16 |
| Oct | 4.9 | 86 | 18 |
| Nov | 11.38 | 88 | 21 |
| Dec | 11.56 | 88 | 20 |
Montezuma Rainfall
| Month | Rainfall | Humidity | Rainy |
|---|---|---|---|
| % | Days | ||
| Jan | 0.41 | 74 | 4 |
| Feb | 0.15 | 71 | 1 |
| Mar | 0.3 | 67 | 2 |
| Apr | 1.55 | 73 | 6 |
| May | 12.57 | 82 | 20 |
| Jun | 9.79 | 85 | 21 |
| Jul | 6.87 | 85 | 20 |
| Aug | 8.25 | 85 | 19 |
| Sep | 11.45 | 85 | 22 |
| Oct | 19.23 | 86 | 25 |
| Nov | 4 | 84 | 14 |
| Dec | 0.77 | 80 | 7 |
Ocotal Rainfall
| Month | Rainfall | Humidity | Rainy |
|---|---|---|---|
| % | Days | ||
| Jan | 0.09 | 60 | 1 |
| Feb | 0.13 | 56 | 2 |
| Mar | 0.14 | 54 | 1 |
| Apr | 1.57 | 57 | 3 |
| May | 8.28 | 73 | 15 |
| Jun | 7.25 | 81 | 16 |
| Jul | 4.52 | 77 | 13 |
| Aug | 7.62 | 80 | 18 |
| Sep | 13.4 | 86 | 23 |
| Oct | 14.27 | 87 | 22 |
| Nov | 3.81 | 79 | 11 |
| Dec | 0.41 | 68 | 3 |
Osa Peninsula Rainfall
| Month | Rainfall | Humidity | Rainy |
|---|---|---|---|
| % | Days | ||
| Jan | 2.14 | 83 | 12 |
| Feb | 1.43 | 80 | 7 |
| Mar | 2.79 | 80 | 11 |
| Apr | 7.19 | 84 | 18 |
| May | 16.42 | 87 | 26 |
| Jun | 14.69 | 87 | 25 |
| Jul | 13.98 | 88 | 26 |
| Aug | 16.46 | 88 | 28 |
| Sep | 17.96 | 88 | 27 |
| Oct | 27.62 | 90 | 28 |
| Nov | 17.94 | 90 | 27 |
| Dec | 6.65 | 86 | 20 |
Papagayo Rainfall
| Month | Rainfall | Humidity | Rainy |
|---|---|---|---|
| % | Days | ||
| Jan | 0.09 | 60 | 1 |
| Feb | 0.13 | 56 | 2 |
| Mar | 0.14 | 54 | 1 |
| Apr | 1.57 | 57 | 3 |
| May | 8.28 | 73 | 15 |
| Jun | 7.25 | 81 | 16 |
| Jul | 4.52 | 77 | 13 |
| Aug | 7.62 | 80 | 18 |
| Sep | 13.4 | 86 | 23 |
| Oct | 14.27 | 87 | 22 |
| Nov | 3.81 | 79 | 11 |
| Dec | 0.41 | 68 | 3 |
Playa Avellanas Rainfall
| Month | Rainfall | Humidity | Rainy |
|---|---|---|---|
| % | Days | ||
| Jan | 0.06 | 62 | 1 |
| Feb | 0.07 | 59 | 1 |
| Mar | 0.22 | 58 | 2 |
| Apr | 1.01 | 64 | 3 |
| May | 6.94 | 78 | 14 |
| Jun | 6.08 | 83 | 17 |
| Jul | 5.45 | 80 | 15 |
| Aug | 9.1 | 83 | 18 |
| Sep | 11.88 | 87 | 21 |
| Oct | 18.39 | 88 | 23 |
| Nov | 3 | 80 | 10 |
| Dec | 0.7 | 71 | 2 |
Playa Cocles Rainfall
| Month | Rainfall | Humidity | Rainy |
|---|---|---|---|
| % | Days | ||
| Jan | 8.25 | 88 | 18 |
| Feb | 8.77 | 85 | 18 |
| Mar | 8.58 | 84 | 18 |
| Apr | 6.81 | 85 | 15 |
| May | 11.44 | 86 | 20 |
| Jun | 8.81 | 87 | 19 |
| Jul | 16.14 | 88 | 25 |
| Aug | 7.94 | 86 | 18 |
| Sep | 5.06 | 85 | 16 |
| Oct | 4.9 | 86 | 18 |
| Nov | 11.38 | 88 | 21 |
| Dec | 11.56 | 88 | 20 |
Playa Conchal Rainfall
| Month | Rainfall | Humidity | Rainy |
|---|---|---|---|
| % | Days | ||
| Jan | 0.06 | 62 | 1 |
| Feb | 0.07 | 59 | 1 |
| Mar | 0.22 | 58 | 2 |
| Apr | 1.01 | 64 | 3 |
| May | 6.94 | 78 | 14 |
| Jun | 6.08 | 83 | 17 |
| Jul | 5.45 | 80 | 15 |
| Aug | 9.1 | 83 | 18 |
| Sep | 11.88 | 87 | 21 |
| Oct | 18.39 | 88 | 23 |
| Nov | 3 | 80 | 10 |
| Dec | 0.7 | 71 | 2 |
Playa del Coco Rainfall
| Month | Rainfall | Humidity | Rainy |
|---|---|---|---|
| % | Days | ||
| Jan | 0.09 | 60 | 1 |
| Feb | 0.13 | 56 | 2 |
| Mar | 0.14 | 54 | 1 |
| Apr | 1.57 | 57 | 3 |
| May | 8.28 | 73 | 15 |
| Jun | 7.25 | 81 | 16 |
| Jul | 4.52 | 77 | 13 |
| Aug | 7.62 | 80 | 18 |
| Sep | 13.4 | 86 | 23 |
| Oct | 14.27 | 87 | 22 |
| Nov | 3.81 | 79 | 11 |
| Dec | 0.41 | 68 | 3 |
Playa Grande Rainfall
| Month | Rainfall | Humidity | Rainy |
|---|---|---|---|
| % | Days | ||
| Jan | 0.06 | 62 | 1 |
| Feb | 0.07 | 59 | 1 |
| Mar | 0.22 | 58 | 2 |
| Apr | 1.01 | 64 | 3 |
| May | 6.94 | 78 | 14 |
| Jun | 6.08 | 83 | 17 |
| Jul | 5.45 | 80 | 15 |
| Aug | 9.1 | 83 | 18 |
| Sep | 11.88 | 87 | 21 |
| Oct | 18.39 | 88 | 23 |
| Nov | 3 | 80 | 10 |
| Dec | 0.7 | 71 | 2 |
Playa Hermosa – Guanacaste Rainfall
| Month | Rainfall | Humidity | Rainy |
|---|---|---|---|
| % | Days | ||
| Jan | 0.09 | 60 | 1 |
| Feb | 0.13 | 56 | 2 |
| Mar | 0.14 | 54 | 1 |
| Apr | 1.57 | 57 | 3 |
| May | 8.28 | 73 | 15 |
| Jun | 7.25 | 81 | 16 |
| Jul | 4.52 | 77 | 13 |
| Aug | 7.62 | 80 | 18 |
| Sep | 13.4 | 86 | 23 |
| Oct | 14.27 | 87 | 22 |
| Nov | 3.81 | 79 | 11 |
| Dec | 0.41 | 68 | 3 |
Potrero Rainfall
| Month | Rainfall | Humidity | Rainy |
|---|---|---|---|
| % | Days | ||
| Jan | 0.06 | 62 | 1 |
| Feb | 0.07 | 59 | 1 |
| Mar | 0.22 | 58 | 2 |
| Apr | 1.01 | 64 | 3 |
| May | 6.94 | 78 | 14 |
| Jun | 6.08 | 83 | 17 |
| Jul | 5.45 | 80 | 15 |
| Aug | 9.1 | 83 | 18 |
| Sep | 11.88 | 87 | 21 |
| Oct | 18.39 | 88 | 23 |
| Nov | 3 | 80 | 10 |
| Dec | 0.7 | 71 | 2 |
Puerto Jimenez Rainfall
| Month | Rainfall | Humidity | Rainy |
|---|---|---|---|
| % | Days | ||
| Jan | 2.14 | 83 | 12 |
| Feb | 1.43 | 80 | 7 |
| Mar | 2.79 | 80 | 11 |
| Apr | 7.19 | 84 | 18 |
| May | 16.42 | 87 | 26 |
| Jun | 14.69 | 87 | 25 |
| Jul | 13.98 | 88 | 26 |
| Aug | 16.46 | 88 | 28 |
| Sep | 17.96 | 88 | 27 |
| Oct | 27.62 | 90 | 28 |
| Nov | 17.94 | 90 | 27 |
| Dec | 6.65 | 86 | 20 |
Puerto Viejo Rainfall
| Month | Rainfall | Humidity | Rainy |
|---|---|---|---|
| % | Days | ||
| Jan | 8.25 | 88 | 18 |
| Feb | 8.77 | 85 | 18 |
| Mar | 8.58 | 84 | 18 |
| Apr | 6.81 | 85 | 15 |
| May | 11.44 | 86 | 20 |
| Jun | 8.81 | 87 | 19 |
| Jul | 16.14 | 88 | 25 |
| Aug | 7.94 | 86 | 18 |
| Sep | 5.06 | 85 | 16 |
| Oct | 4.9 | 86 | 18 |
| Nov | 11.38 | 88 | 21 |
| Dec | 11.56 | 88 | 20 |
Puerto Viejo de Sarapiqui Rainfall
| Month | Rainfall | Humidity | Rainy |
|---|---|---|---|
| % | Days | ||
| Jan | 13.22 | 87 | 25 |
| Feb | 7.43 | 84 | 18 |
| Mar | 6.64 | 83 | 18 |
| Apr | 5.68 | 83 | 17 |
| May | 13.43 | 85 | 23 |
| Jun | 15.7 | 87 | 24 |
| Jul | 18.95 | 88 | 26 |
| Aug | 13.48 | 88 | 24 |
| Sep | 9.69 | 86 | 21 |
| Oct | 10.6 | 87 | 24 |
| Nov | 16.69 | 89 | 24 |
| Dec | 16.48 | 88 | 27 |
San Isidro del General Rainfall
| Month | Rainfall | Humidity | Rainy |
|---|---|---|---|
| % | Days | ||
| Jan | 4.59 | 80 | 15 |
| Feb | 3.59 | 76 | 10 |
| Mar | 6.6 | 77 | 16 |
| Apr | 17.21 | 82 | 24 |
| May | 20.06 | 86 | 28 |
| Jun | 14.02 | 86 | 24 |
| Jul | 11.57 | 86 | 22 |
| Aug | 19.26 | 86 | 27 |
| Sep | 22.35 | 86 | 26 |
| Oct | 27.9 | 89 | 30 |
| Nov | 22.22 | 90 | 29 |
| Dec | 10.18 | 86 | 24 |
San Jose Rainfall
| Month | Rainfall | Humidity | Rainy |
|---|---|---|---|
| % | Days | ||
| Jan | 0.55 | 74 | 5 |
| Feb | 0.48 | 72 | 3 |
| Mar | 0.44 | 72 | 3 |
| Apr | 1.85 | 72 | 8 |
| May | 9.96 | 78 | 20 |
| Jun | 9.57 | 79 | 21 |
| Jul | 6.88 | 77 | 20 |
| Aug | 8.15 | 77 | 21 |
| Sep | 12.61 | 79 | 23 |
| Oct | 11.67 | 81 | 25 |
| Nov | 5.39 | 78 | 17 |
| Dec | 1.33 | 75 | 8 |
San Pedro Rainfall
| Month | Rainfall | Humidity | Rainy |
|---|---|---|---|
| % | Days | ||
| Jan | 0.55 | 74 | 5 |
| Feb | 0.48 | 72 | 3 |
| Mar | 0.44 | 72 | 3 |
| Apr | 1.85 | 72 | 8 |
| May | 9.96 | 78 | 20 |
| Jun | 9.57 | 79 | 21 |
| Jul | 6.88 | 77 | 20 |
| Aug | 8.15 | 77 | 21 |
| Sep | 12.61 | 79 | 23 |
| Oct | 11.67 | 81 | 25 |
| Nov | 5.39 | 78 | 17 |
| Dec | 1.33 | 75 | 8 |
Santa Teresa Rainfall
| Month | Rainfall | Humidity | Rainy |
|---|---|---|---|
| % | Days | ||
| Jan | 0.41 | 74 | 4 |
| Feb | 0.15 | 71 | 1 |
| Mar | 0.3 | 67 | 2 |
| Apr | 1.55 | 73 | 6 |
| May | 12.57 | 82 | 20 |
| Jun | 9.79 | 85 | 21 |
| Jul | 6.87 | 85 | 20 |
| Aug | 8.25 | 85 | 19 |
| Sep | 11.45 | 85 | 22 |
| Oct | 19.23 | 86 | 25 |
| Nov | 4 | 84 | 14 |
| Dec | 0.77 | 80 | 7 |
Tamarindo Rainfall
| Month | Rainfall | Humidity | Rainy |
|---|---|---|---|
| % | Days | ||
| Jan | 0.06 | 62 | 1 |
| Feb | 0.07 | 59 | 1 |
| Mar | 0.22 | 58 | 2 |
| Apr | 1.01 | 64 | 3 |
| May | 6.94 | 78 | 14 |
| Jun | 6.08 | 83 | 17 |
| Jul | 5.45 | 80 | 15 |
| Aug | 9.1 | 83 | 18 |
| Sep | 11.88 | 87 | 21 |
| Oct | 18.39 | 88 | 23 |
| Nov | 3 | 80 | 10 |
| Dec | 0.7 | 71 | 2 |
Tortuguero Rainfall
| Month | Rainfall | Humidity | Rainy |
|---|---|---|---|
| % | Days | ||
| Jan | 15.84 | 92 | 26 |
| Feb | 8.18 | 90 | 17 |
| Mar | 8.85 | 90 | 20 |
| Apr | 8.34 | 89 | 18 |
| May | 16.25 | 91 | 22 |
| Jun | 14.38 | 92 | 21 |
| Jul | 19.73 | 93 | 26 |
| Aug | 13.2 | 92 | 23 |
| Sep | 6.72 | 90 | 19 |
| Oct | 10.17 | 91 | 23 |
| Nov | 19.85 | 93 | 24 |
| Dec | 22.08 | 94 | 25 |
Today's Tide Times
Papagayo
July 29
| Tide | Time | Height |
|---|---|---|
| High | 2:47 AM | 2.39 m |
| Low | 8:41 AM | 0.50 m |
| High | 2:53 PM | 2.55 m |
| Low | 9:06 PM | 0.21 m |
Tamarindo
July 29
| Tide | Time | Height |
|---|---|---|
| High | 2:47 AM | 2.39 m |
| Low | 8:41 AM | 0.50 m |
| High | 2:53 PM | 2.55 m |
| Low | 9:06 PM | 0.21 m |
Manuel Antonio
July 29
| Tide | Time | Height |
|---|---|---|
| High | 2:43 AM | 2.42 m |
| Low | 8:42 AM | 0.53 m |
| High | 2:49 PM | 2.58 m |
| Low | 9:07 PM | 0.24 m |